1
2
3
4
5
6
7
8
9
10
11
12
13
14
15
16
17
18
19
20
21
22
23
24
25
26
27
28
29
30
31
32
33
34
35
| fwd, stc = make_forward_dipole(dip, fname_bem, evoked.info, fname_trans)
pred_evoked = simulate_evoked(fwd, stc, evoked.info, cov=None, nave=np.inf)
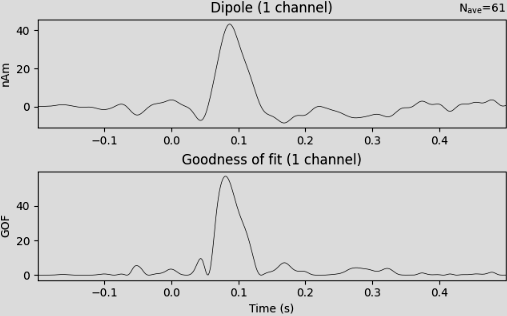
best_idx = np.argmax(dip.gof)
best_time = dip.times[best_idx]
print(
f"Highest GOF {dip.gof[best_idx]:0.1f}% at t={best_time * 1000:0.1f} ms with "
f"confidence volume {dip.conf['vol'][best_idx] * 100**3:0.1f} cm^3"
)
fig, axes = plt.subplots(
nrows=1,
ncols=4,
figsize=[10.0, 3.4],
gridspec_kw=dict(width_ratios=[1, 1, 1, 0.1], top=0.85),
layout="constrained",
)
vmin, vmax = -400, 400
plot_params = dict(times=best_time, ch_type="mag", outlines="head", colorbar=False)
evoked.plot_topomap(time_format="Measured field", axes=axes[0], **plot_params)
pred_evoked.plot_topomap(time_format="Predicted field", axes=axes[1], **plot_params)
diff = combine_evoked([evoked, pred_evoked], weights=[1, -1])
plot_params["colorbar"] = True
diff.plot_topomap(time_format="Difference", axes=axes[2:], **plot_params)
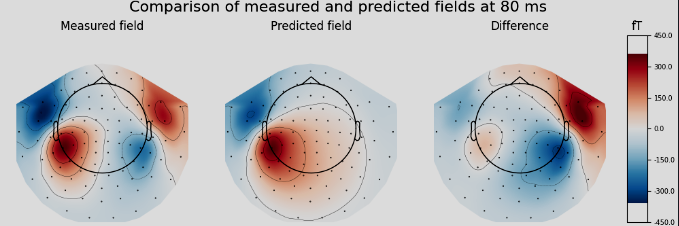
fig.suptitle(
f"Comparison of measured and predicted fields at {best_time * 1000:.0f} ms",
fontsize=16,
)
|

 - 荔枝树&pics=/assets/post/MNE.png&summary=官网教程翻译+个人学习python-mne的经验)


