mne.report是一种创建交互式HTML数据摘要的方法。report可以为对象显示很多不同的可视化。
一个常见的用例是在处理pipeline的不同阶段创建诊断摘要来检查数据质量。该报告可以显示像每个预处理步骤前后的数据图、epoch拒绝统计、用BEM模型构建的MRI切片、皮质活动情况估算图。与Jupyter notebook相比,mne.Report更容易部署,因为它生成的HTML页面是自包含的,不需要运行的Python环境。但是,它的灵活性较差,因为不能更改代码并在浏览器中直接重新运行。
和往常一样,我们将从导入需要的模块和数据开始:
1 | import tempfile |
提示,在使用mne.report之前,需要抱枕我们想渲染的文件存寻MNE的文件名规范: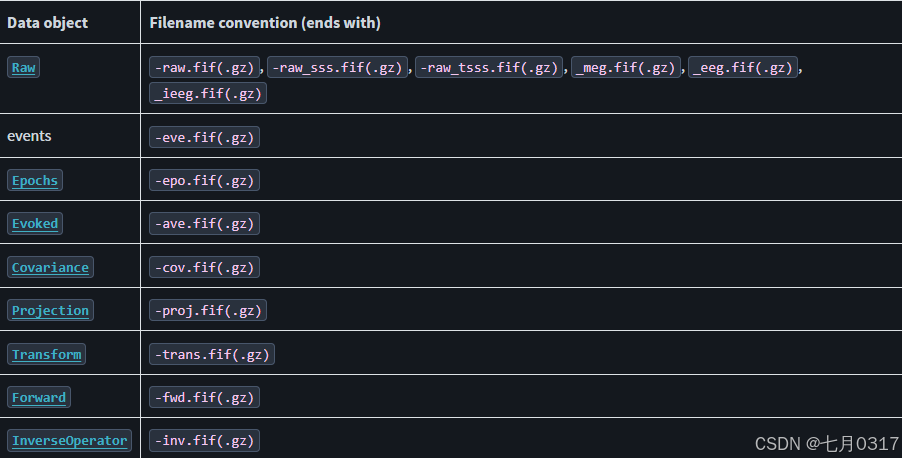
“-”和“_”可以替换。
创建HTML报告的基本过程是实例化report类,然后使用它的一个或多个方法来添加内容,每次添加一个element。
我们还可以使用parse_folder()方法来选择要包含在报告中的特定文件(稍后会介绍)。
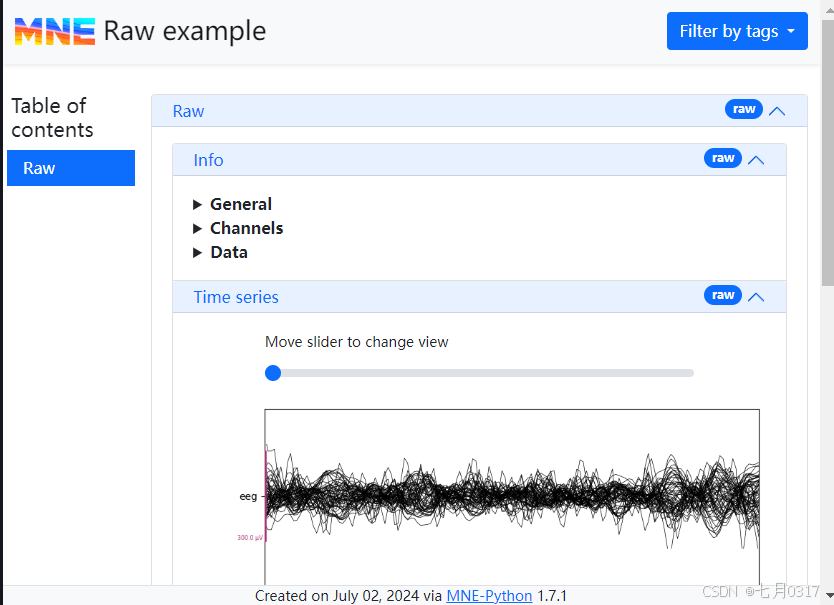
添加Raw数据
raw数据可以通过mne.Report.add_raw()方法添加。它的参数可以是raw文件和raw对象的路径,并将产生一个可滑动的界面,让我们可以浏览10个间距为1秒的数据段,如:
1 | raw_path = sample_dir / "sample_audvis_filt-0-40_raw.fif" |
Opening raw data file /home/circleci/mne_data/MNE-sample-data/MEG/sample/sample_audvis_filt-0-40_raw.fif…
Read a total of 4 projection items:
PCA-v1 (1 x 10²) idle
PCA-v2 (1 x 10²) idle
PCA-v3 (1 x 10²) idle
Average EEG reference (1 x 60) idle
Range : 6450 … 48149 = 42.956 … 320.665 secs
Ready.
Reading 0 … 9009 = 0.000 … 59.999 secs…
Embedding : jquery-3.6.0.min.js
Embedding : bootstrap.bundle.min.js
Embedding : bootstrap.min.css
Embedding : bootstrap-table/bootstrap-table.min.js
Embedding : bootstrap-table/bootstrap-table.min.css
Embedding : bootstrap-table/bootstrap-table-copy-rows.min.js
Embedding : bootstrap-table/bootstrap-table-export.min.js
Embedding : bootstrap-table/tableExport.min.js
Embedding : bootstrap-icons/bootstrap-icons.mne.min.css
Embedding : highlightjs/highlight.min.js
Embedding : highlightjs/atom-one-dark-reasonable.min.css
Using matplotlib as 2D backend.
Using qt as 2D backend.
Saving report to : /home/circleci/project/tutorials/intro/report_raw.html
添加events
event可以通过mne.Report.add_events()的方法添加到html文档中。我们还需要提供记录期间使用的采样率,用于生成有意义的时间轴。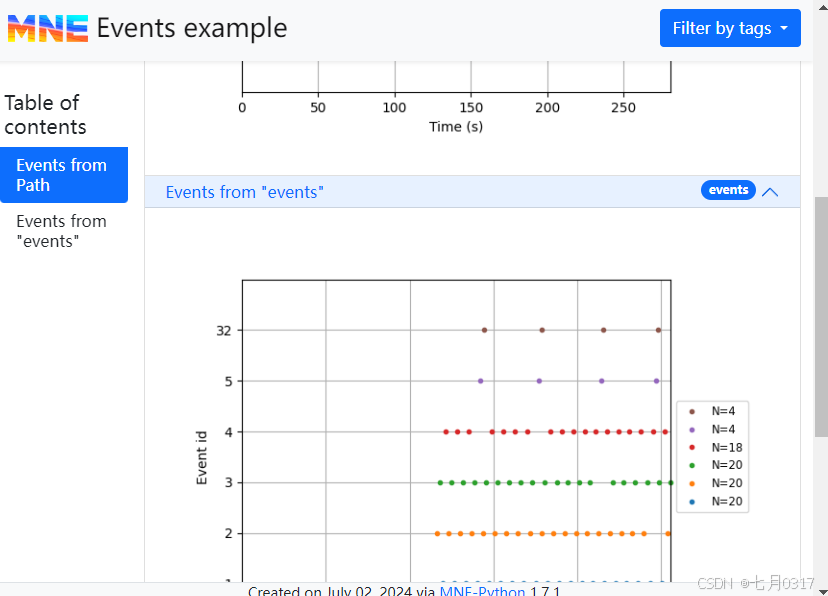
86 events found on stim channel STI 014
Event IDs: [ 1 2 3 4 5 32]
Embedding : jquery-3.6.0.min.js
Embedding : bootstrap.bundle.min.js
Embedding : bootstrap.min.css
Embedding : bootstrap-table/bootstrap-table.min.js
Embedding : bootstrap-table/bootstrap-table.min.css
Embedding : bootstrap-table/bootstrap-table-copy-rows.min.js
Embedding : bootstrap-table/bootstrap-table-export.min.js
Embedding : bootstrap-table/tableExport.min.js
Embedding : bootstrap-icons/bootstrap-icons.mne.min.css
Embedding : highlightjs/highlight.min.js
Embedding : highlightjs/atom-one-dark-reasonable.min.css
Saving report to : /home/circleci/project/tutorials/intro/report_events.html
添加epochs
epoch可以通过mne.Report.add_epochs()添加。请注意,此方法也接受epoch文件的路径,但在下面的示例中,我们只添加从raw数据动态创建的epoch。为了演示epoch元数据的表示,我们也将添加一些epoch元数据。
1 | event_id = { |
我们添加了metadata,mne.epochs.make_metadata()这个函数模拟了epoch过程,它围绕固定时间区间的“感兴趣事件”构建时间窗,并整理在这些时间窗口内发生的任何其他事件的信息。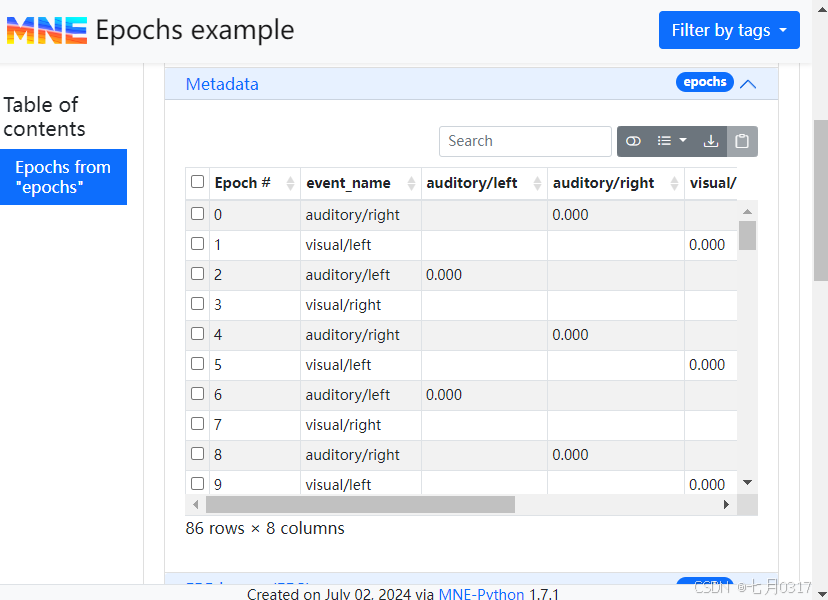
Adding metadata with 7 columns
86 matching events found
Setting baseline interval to [-0.19979521315838786, 0.0] s
Applying baseline correction (mode: mean)
Created an SSP operator (subspace dimension = 1)
1 projection items activated
Embedding : jquery-3.6.0.min.js
Embedding : bootstrap.bundle.min.js
Embedding : bootstrap.min.css
Embedding : bootstrap-table/bootstrap-table.min.js
Embedding : bootstrap-table/bootstrap-table.min.css
Embedding : bootstrap-table/bootstrap-table-copy-rows.min.js
Embedding : bootstrap-table/bootstrap-table-export.min.js
Embedding : bootstrap-table/tableExport.min.js
Embedding : bootstrap-icons/bootstrap-icons.mne.min.css
Embedding : highlightjs/highlight.min.js
Embedding : highlightjs/atom-one-dark-reasonable.min.css
Using data from preloaded Raw for 86 events and 106 original time points …
0 bad epochs dropped
Using multitaper spectrum estimation with 7 DPSS windows
Plotting power spectral density (dB=True).
Averaging across epochs…
Saving report to : /home/circleci/project/tutorials/intro/report_epochs.html
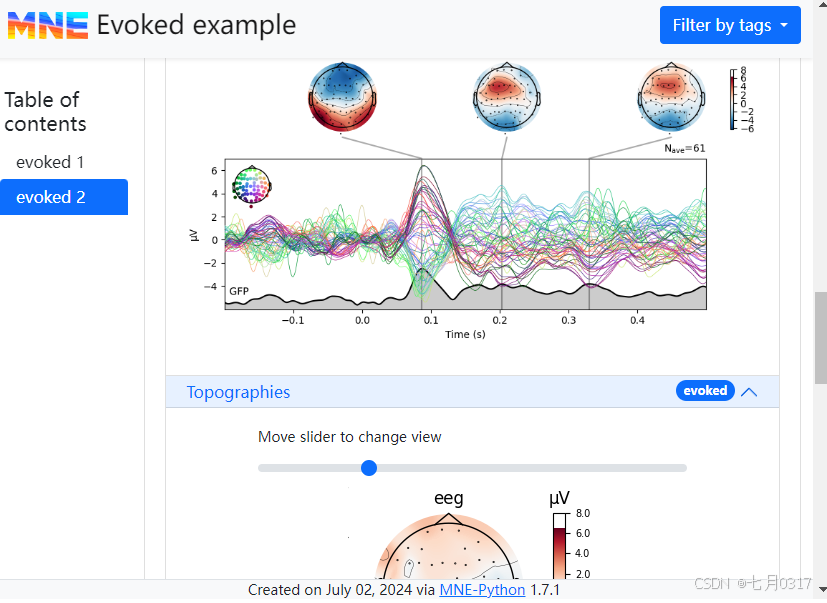
添加evoked
可以通过mne.Report.add_evokeds()添加evoked数据。默认情况下,每个evoked对象的Evoked .comment属性将用作标题。当然我们可以通过标题参数自定义标题。同样,这种方法也接受路径。
在下面的示例中,我们首先手动加载evoked对象,因为我们只想将其中的一个子集添加到report中。evoked没有经过基线校正,因此我们先应用了基线校正。最后,通过使用噪声协方差校正的方法,我们可以添加使用这个协方差矩阵处理后的图。
默认情况下,该方法将在21个或更少的等间隔时间点生成快照。我们可以通过n_time_points参数进行调整。
1 | evoked_path = sample_dir / "sample_audvis-ave.fif" |
Reading /home/circleci/mne_data/MNE-sample-data/MEG/sample/sample_audvis-ave.fif …
Read a total of 4 projection items:
PCA-v1 (1 x 10²) active
PCA-v2 (1 x 10²) active
PCA-v3 (1 x 10²) active
Average EEG reference (1 x 60) active
Found the data of interest:
t = -199.80 … 499.49 ms (Left Auditory)
0 CTF compensation matrices available
nave = 55 - aspect type = 100
Projections have already been applied. Setting proj attribute to True.
Applying baseline correction (mode: mean)
Read a total of 4 projection items:
PCA-v1 (1 x 10²) active
PCA-v2 (1 x 10²) active
PCA-v3 (1 x 10²) active
Average EEG reference (1 x 60) active
Found the data of interest:
t = -199.80 … 499.49 ms (Right Auditory)
0 CTF compensation matrices available
nave = 61 - aspect type = 100
Projections have already been applied. Setting proj attribute to True.
Applying baseline correction (mode: mean)
Read a total of 4 projection items:
PCA-v1 (1 x 10²) active
PCA-v2 (1 x 10²) active
PCA-v3 (1 x 10²) active
Average EEG reference (1 x 60) active
Found the data of interest:
t = -199.80 … 499.49 ms (Left visual)
0 CTF compensation matrices available
nave = 67 - aspect type = 100
Projections have already been applied. Setting proj attribute to True.
Applying baseline correction (mode: mean)
Read a total of 4 projection items:
PCA-v1 (1 x 10²) active
PCA-v2 (1 x 10²) active
PCA-v3 (1 x 10²) active
Average EEG reference (1 x 60) active
Found the data of interest:
t = -199.80 … 499.49 ms (Right visual)
0 CTF compensation matrices available
nave = 58 - aspect type = 100
Projections have already been applied. Setting proj attribute to True.
Applying baseline correction (mode: mean)
Embedding : jquery-3.6.0.min.js
Embedding : bootstrap.bundle.min.js
Embedding : bootstrap.min.css
Embedding : bootstrap-table/bootstrap-table.min.js
Embedding : bootstrap-table/bootstrap-table.min.css
Embedding : bootstrap-table/bootstrap-table-copy-rows.min.js
Embedding : bootstrap-table/bootstrap-table-export.min.js
Embedding : bootstrap-table/tableExport.min.js
Embedding : bootstrap-icons/bootstrap-icons.mne.min.css
Embedding : highlightjs/highlight.min.js
Embedding : highlightjs/atom-one-dark-reasonable.min.css
366 x 366 full covariance (kind = 1) found.
Read a total of 4 projection items:
PCA-v1 (1 x 10²) active
PCA-v2 (1 x 10²) active
PCA-v3 (1 x 10²) active
Average EEG reference (1 x 60) active
NOTE: pick_types() is a legacy function. New code should use inst.pick(…).
Computing rank from covariance with rank=None
Using tolerance 4.7e-14 (2.2e-16 eps * 59 dim * 3.6 max singular value)
Estimated rank (eeg): 58
EEG: rank 58 computed from 59 data channels with 1 projector
Created an SSP operator (subspace dimension = 1)
Computing rank from covariance with rank={‘eeg’: 58}
Setting small EEG eigenvalues to zero (without PCA)
Created the whitener using a noise covariance matrix with rank 58 (1 small eigenvalues omitted)
Saving report to : /home/circleci/project/tutorials/intro/report_evoked.html
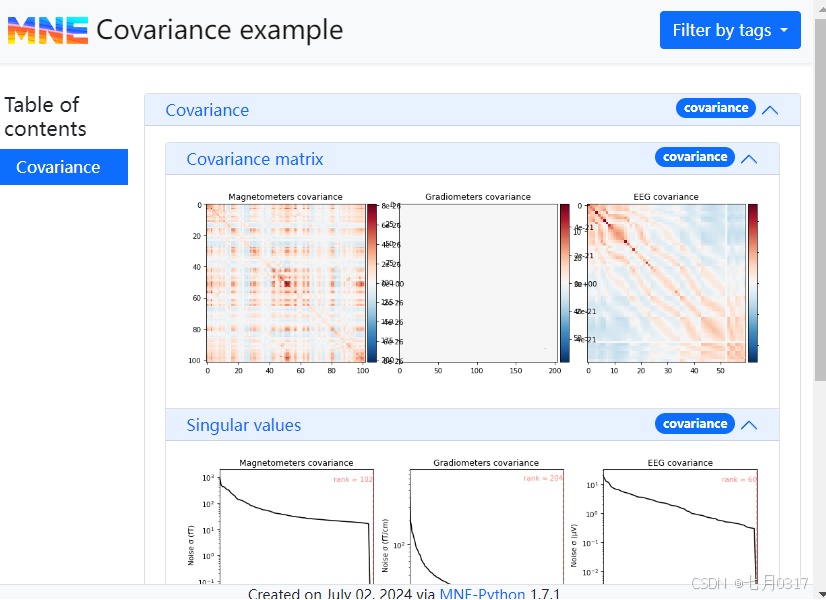
添加covariance(协方差)
这是一个独立的对象,跟以上提到的那几个一样。噪声协方差对象可以通过mne.Report.add_covariance()添加。该方法接受Covariance对象本身或者它的路径。该函数期望我们传递一个Info对象或一个info的路径,以及一个标题。
1 | cov_path = sample_dir / "sample_audvis-cov.fif" |
Embedding : jquery-3.6.0.min.js
Embedding : bootstrap.bundle.min.js
Embedding : bootstrap.min.css
Embedding : bootstrap-table/bootstrap-table.min.js
Embedding : bootstrap-table/bootstrap-table.min.css
Embedding : bootstrap-table/bootstrap-table-copy-rows.min.js
Embedding : bootstrap-table/bootstrap-table-export.min.js
Embedding : bootstrap-table/tableExport.min.js
Embedding : bootstrap-icons/bootstrap-icons.mne.min.css
Embedding : highlightjs/highlight.min.js
Embedding : highlightjs/atom-one-dark-reasonable.min.css
366 x 366 full covariance (kind = 1) found.
Read a total of 4 projection items:
PCA-v1 (1 x 10²) active
PCA-v2 (1 x 10²) active
PCA-v3 (1 x 10²) active
Average EEG reference (1 x 60) active
Read a total of 4 projection items:
PCA-v1 (1 x 10²) idle
PCA-v2 (1 x 10²) idle
PCA-v3 (1 x 10²) idle
Average EEG reference (1 x 60) idle
Computing rank from covariance with rank=None
Using tolerance 2.5e-14 (2.2e-16 eps * 102 dim * 1.1 max singular value)
Estimated rank (mag): 102
MAG: rank 102 computed from 102 data channels with 0 projectors
Computing rank from covariance with rank=None
Using tolerance 2.6e-12 (2.2e-16 eps * 204 dim * 56 max singular value)
Estimated rank (grad): 204
GRAD: rank 204 computed from 204 data channels with 0 projectors
Computing rank from covariance with rank=None
Using tolerance 4.8e-14 (2.2e-16 eps * 60 dim * 3.6 max singular value)
Estimated rank (eeg): 60
EEG: rank 60 computed from 60 data channels with 0 projectors
Saving report to : /home/circleci/project/tutorials/intro/report_cov.html
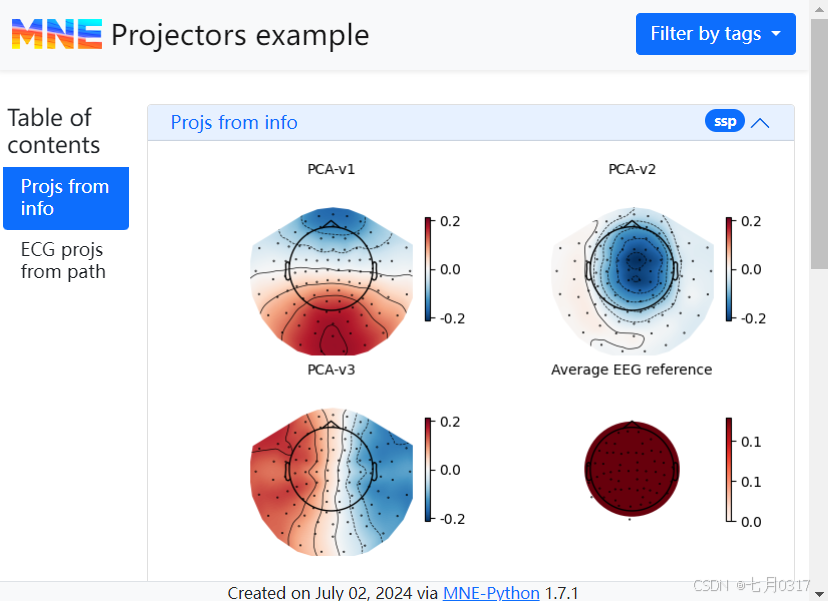
添加投射向量对象
投影向量(projection)可以通过mne.Report.add_projs()添加。该方法需要一个Info对象或Info对象的路径和一个标题。所有在info中有的projector都将被可视化。
我们还可以提供一个projectoon对象列表或路径。但在这种情况下,从Info中能读取通道信息,但info中包含的projector将被忽略。
1 | ecg_proj_path = sample_dir / "sample_audvis_ecg-proj.fif" |
Embedding : jquery-3.6.0.min.js
Embedding : bootstrap.bundle.min.js
Embedding : bootstrap.min.css
Embedding : bootstrap-table/bootstrap-table.min.js
Embedding : bootstrap-table/bootstrap-table.min.css
Embedding : bootstrap-table/bootstrap-table-copy-rows.min.js
Embedding : bootstrap-table/bootstrap-table-export.min.js
Embedding : bootstrap-table/tableExport.min.js
Embedding : bootstrap-icons/bootstrap-icons.mne.min.css
Embedding : highlightjs/highlight.min.js
Embedding : highlightjs/atom-one-dark-reasonable.min.css
Read a total of 6 projection items:
ECG-planar-999–0.200-0.400-PCA-01 (1 x 203) idle
ECG-planar-999–0.200-0.400-PCA-02 (1 x 203) idle
ECG-axial-999–0.200-0.400-PCA-01 (1 x 10²) idle
ECG-axial-999–0.200-0.400-PCA-02 (1 x 10²) idle
ECG-eeg-999–0.200-0.400-PCA-01 (1 x 59) idle
ECG-eeg-999–0.200-0.400-PCA-02 (1 x 59) idle
Saving report to : /home/circleci/project/tutorials/intro/report_projs.html
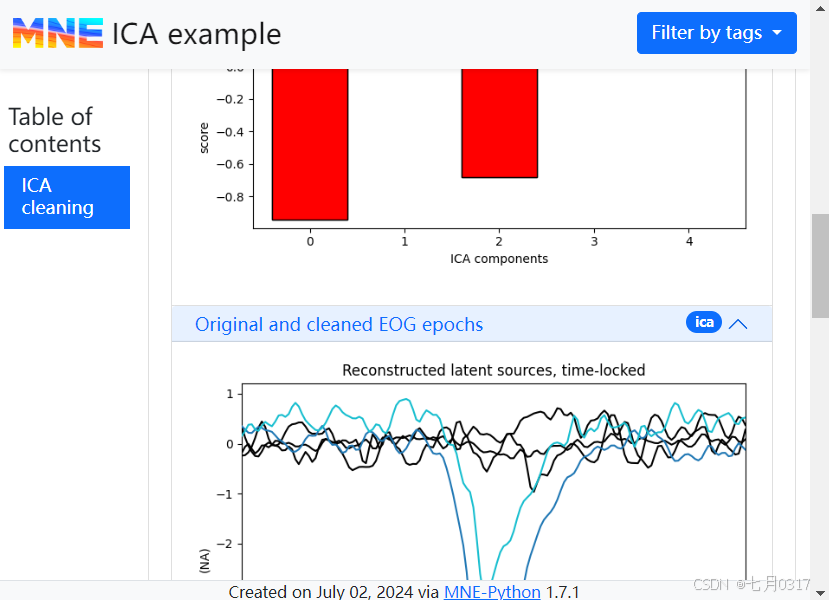
添加ICA
ICA对象可以通过mne.Report.add_ica()添加。除了要接受ica实例或ica对象的路径、标题之外,还有第三个必需参数inst. inst用于指定Raw或Epochs对象,用于生成ica的property图和overlay图,以展示ica效果。如果只想生成ICA各成分的地形图,则传递inst=None。
注意,mne.Report.add_ica() 只对匹配的ICA生效。
我们可以通过传递picks来指定为哪些组件生成地形和属性图。默认情况显示所有组件。
基于ECG和EOG事件的诱发信号也可以通过ecg_evoked和eog_evoked传递。这让我们可以直接看到ICA成分去除对信号的影响。find_bads_ecg()和find_bads_og()产生的伪影检测评分可以分别通过ecg_scores和eog_scores参数传递,从而产生每个ICA组件的评分可视化。最后,通过传递n_jobs,我们可以通过支持并行操作来大大加快属性图的生成。
在下面的例子中,为了节省时间,我们只用了少量的ICA成分来评估,并设置假设ICA收敛到一个非常自由的值的阈值,并且只可视化2个成分。
1 | ica = mne.preprocessing.ICA( |
Fitting ICA to data using 59 channels (please be patient, this may take a while)
Selecting by number: 5 components
Fitting ICA took 0.1s.
Using EOG channel: EOG 061
EOG channel index for this subject is: [69]
Filtering the data to remove DC offset to help distinguish blinks from saccades
Selecting channel EOG 061 for blink detection
Setting up band-pass filter from 1 - 10 Hz
FIR filter parameters
Designing a two-pass forward and reverse, zero-phase, non-causal bandpass filter:
- Windowed frequency-domain design (firwin2) method
- Hann window
- Lower passband edge: 1.00
- Lower transition bandwidth: 0.50 Hz (-12 dB cutoff frequency: 0.75 Hz)
- Upper passband edge: 10.00 Hz
- Upper transition bandwidth: 0.50 Hz (-12 dB cutoff frequency: 10.25 Hz)
- Filter length: 1502 samples (10.003 s)
Now detecting blinks and generating corresponding events
Found 10 significant peaks
Number of EOG events detected: 10
Not setting metadata
10 matching events found
No baseline correction applied
Created an SSP operator (subspace dimension = 1)
Using data from preloaded Raw for 10 events and 151 original time points …
0 bad epochs dropped
Using EOG channel: EEG 001
Embedding : jquery-3.6.0.min.js
Embedding : bootstrap.bundle.min.js
Embedding : bootstrap.min.css
Embedding : bootstrap-table/bootstrap-table.min.js
Embedding : bootstrap-table/bootstrap-table.min.css
Embedding : bootstrap-table/bootstrap-table-copy-rows.min.js
Embedding : bootstrap-table/bootstrap-table-export.min.js
Embedding : bootstrap-table/tableExport.min.js
Embedding : bootstrap-icons/bootstrap-icons.mne.min.css
Embedding : highlightjs/highlight.min.js
Embedding : highlightjs/atom-one-dark-reasonable.min.css
Applying ICA to Raw instance
Transforming to ICA space (5 components)
Zeroing out 2 ICA components
Projecting back using 59 PCA components
Using matplotlib as 2D backend.
Using qt as 2D backend.
Using multitaper spectrum estimation with 7 DPSS windows
Not setting metadata
30 matching events found
No baseline correction applied
0 projection items activated
Using multitaper spectrum estimation with 7 DPSS windows
Not setting metadata
30 matching events found
No baseline correction applied
0 projection items activated
Saving report to : /home/circleci/project/tutorials/intro/report_ica.html
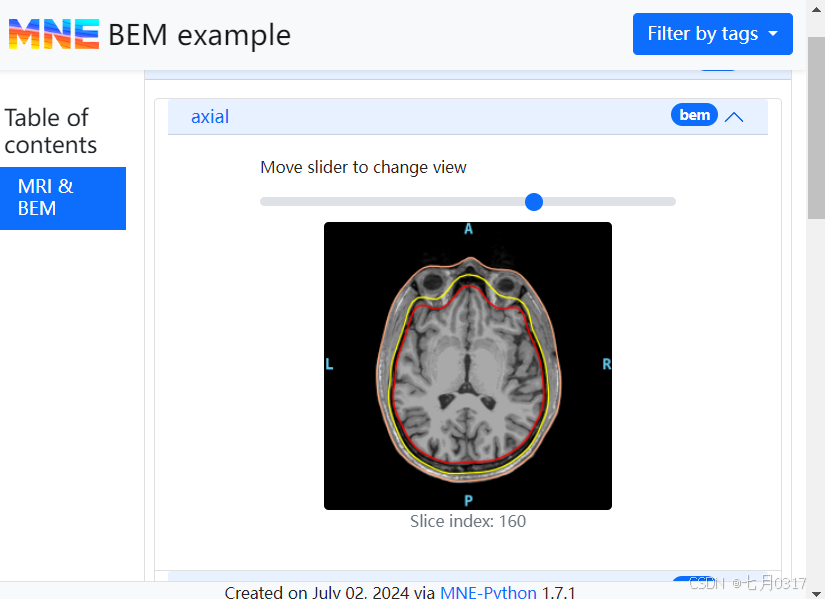
添加BEM建模的MRI信息
可以通过mne.Report.add_bem()添加具有边界元模型(BEM)表面叠加痕迹的MRI切片。我们需要传递的是FreeSurfer subject名称或subjects的目录,以及报告标题。为了减小生成的文件大小,可以通过decim参数只包含每n个volumne的切片,通过width参数指定生成图形的宽度(单位px)。
1 | report = mne.Report(title="BEM example") |
Embedding : jquery-3.6.0.min.js
Embedding : bootstrap.bundle.min.js
Embedding : bootstrap.min.css
Embedding : bootstrap-table/bootstrap-table.min.js
Embedding : bootstrap-table/bootstrap-table.min.css
Embedding : bootstrap-table/bootstrap-table-copy-rows.min.js
Embedding : bootstrap-table/bootstrap-table-export.min.js
Embedding : bootstrap-table/tableExport.min.js
Embedding : bootstrap-icons/bootstrap-icons.mne.min.css
Embedding : highlightjs/highlight.min.js
Embedding : highlightjs/atom-one-dark-reasonable.min.css
Using surface: /home/circleci/mne_data/MNE-sample-data/subjects/sample/bem/inner_skull.surf
Using surface: /home/circleci/mne_data/MNE-sample-data/subjects/sample/bem/outer_skull.surf
Using surface: /home/circleci/mne_data/MNE-sample-data/subjects/sample/bem/outer_skin.surf
Saving report to : /home/circleci/project/tutorials/intro/report_mri_and_bem.html
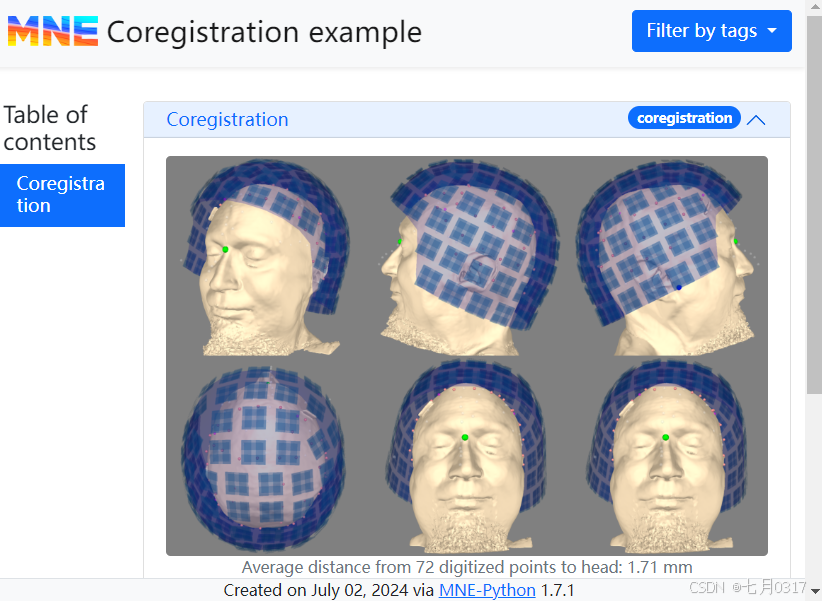
添加配准
通过mne.Report.add_trans()可以可视化传感器对齐,即通过“共配准”获得的head-> mri转换结果。该方法需要一个Transform对象或路径(trans.fif文件),FreeSurfer subject名称或subjects的目录,以及标题。alpha参数可用于控制头部的透明度,其中值为1表示完全不透明。
1 | trans_path = sample_dir / "sample_audvis_raw-trans.fif" |
Embedding : jquery-3.6.0.min.js
Embedding : bootstrap.bundle.min.js
Embedding : bootstrap.min.css
Embedding : bootstrap-table/bootstrap-table.min.js
Embedding : bootstrap-table/bootstrap-table.min.css
Embedding : bootstrap-table/bootstrap-table-copy-rows.min.js
Embedding : bootstrap-table/bootstrap-table-export.min.js
Embedding : bootstrap-table/tableExport.min.js
Embedding : bootstrap-icons/bootstrap-icons.mne.min.css
Embedding : highlightjs/highlight.min.js
Embedding : highlightjs/atom-one-dark-reasonable.min.css
Read a total of 4 projection items:
PCA-v1 (1 x 10²) idle
PCA-v2 (1 x 10²) idle
PCA-v3 (1 x 10²) idle
Average EEG reference (1 x 60) idle
Using lh.seghead for head surface.
Getting helmet for system 306m
Channel types:: grad: 203, mag: 102, eeg: 59
Using surface from /home/circleci/mne_data/MNE-sample-data/subjects/sample/bem/sample-head.fif.
Saving report to : /home/circleci/project/tutorials/intro/report_coregistration.html
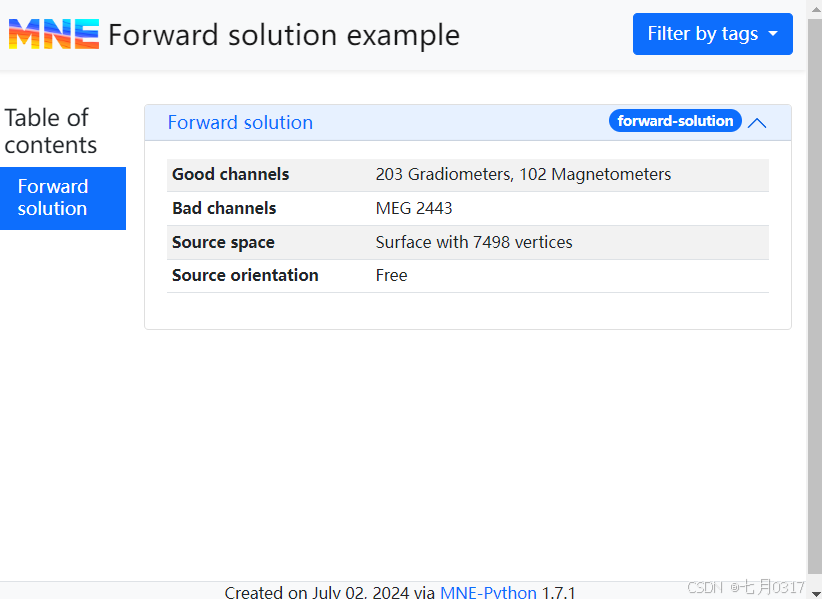
添加正问题
传递一个路径或Forwar对象。用mne.Report.add_forward方法。
1 | fwd_path = sample_dir / "sample_audvis-meg-oct-6-fwd.fif" |
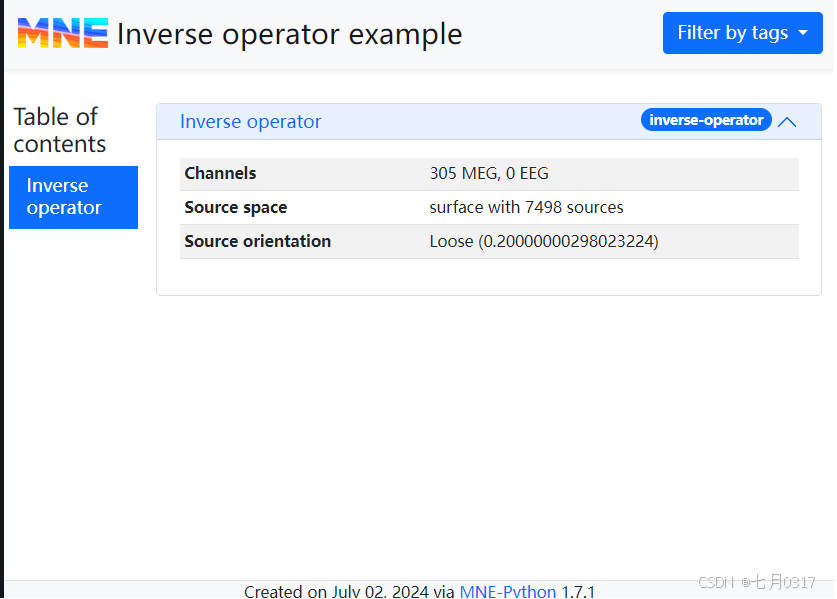
添加逆算子
通过mne.Report.add_inverse_operator()添加。需要一个InverseOperator对象或路径,以及标题。
1 | inverse_op_path = sample_dir / "sample_audvis-meg-oct-6-meg-inv.fif" |
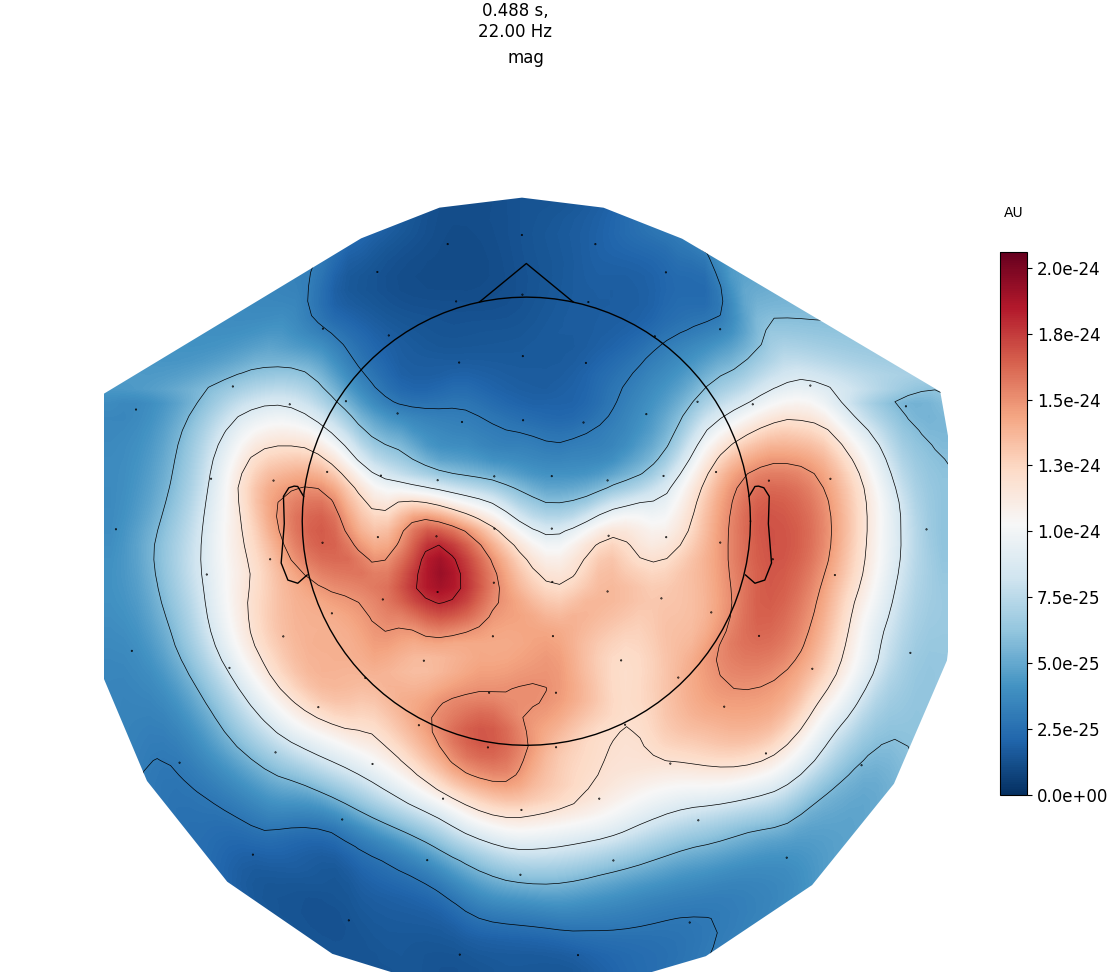
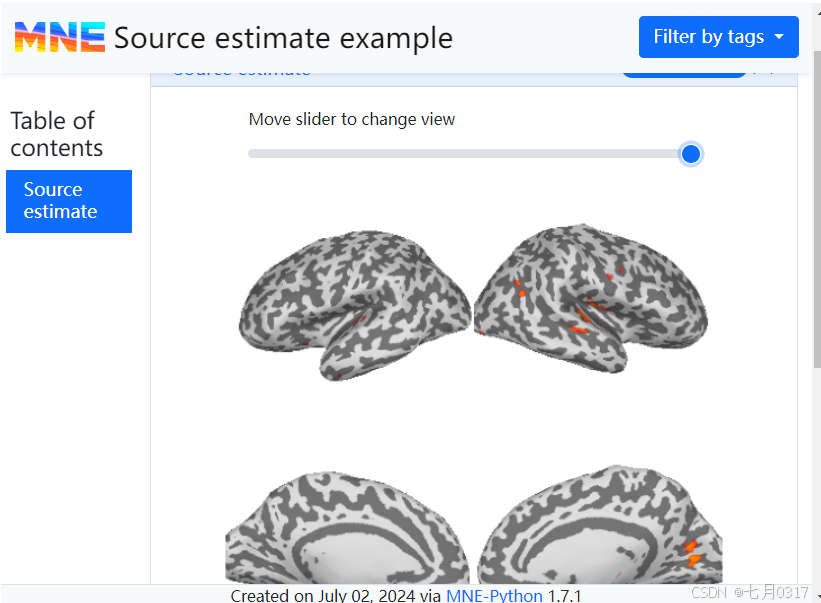
添加源估计(逆问题)
逆问题的解也称为源估计或源时程(source time course, STC)。可以通过mne.Report.add_stc()添加。默认情况下,它将在51个或更少的等间隔时间点生成快照,可以通过n_time_points参数进行调整。
1 | stc_path = sample_dir / "sample_audvis-meg" |
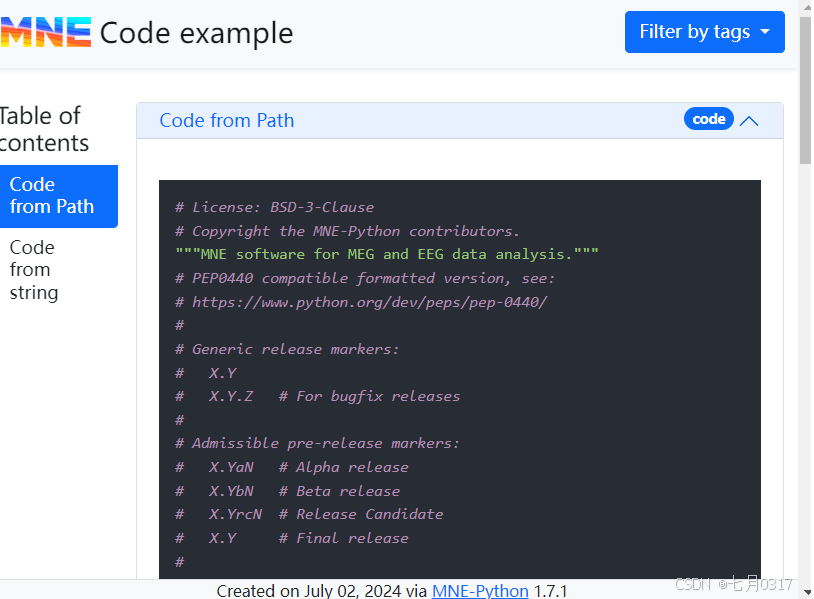
添加源代码
可以通过mne.Report.add_code()向report添加代码或脚本。代码块将自动以语法高亮显示。您可以传递包含相应代码段的字符串,或路径。如果传递一个路径,它必须是一个pathlib.Path对象,否则它将被视为代码文字。还可以通过传递语言参数指定要假定哪种编程语言来突出显示语法。默认情况下是Python。
1 | mne_init_py_path = Path(mne.__file__) # __init__.py in the MNE-Python root |
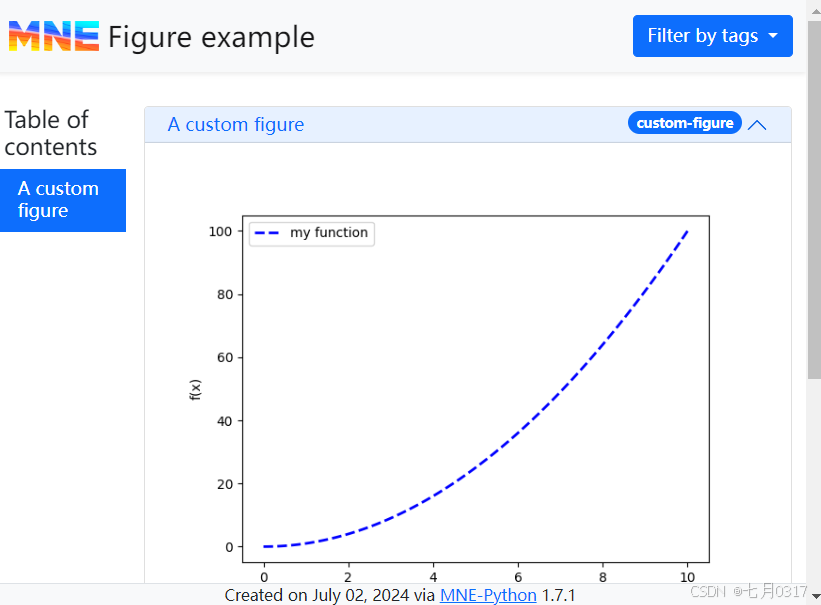
添加自定义图片
自定义Matplotlib图形可以通过add_figure()添加。必需的参数是图形本身和标题。可以选择在图的下方添加标题,还可以指定将从图中生成的图像文件的格式,以便它可以嵌入到HTML报告中。
1 | x = np.linspace(start=0, stop=10, num=100) |
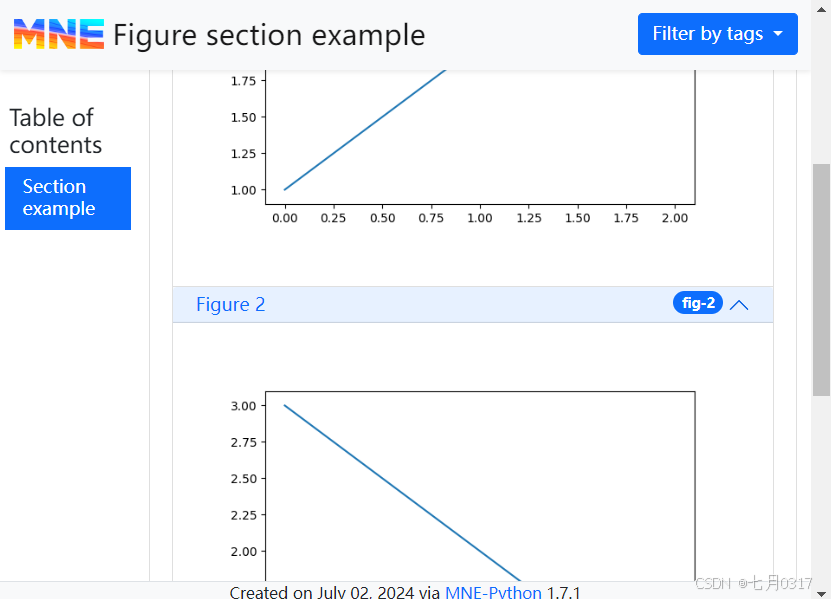
可以通过section参数将多个图形分组为单个section。
1 | fig_1, ax_1 = plt.subplots() |
mne.Report.add_figure()方法也可以一次添加多个图片。在这种情况下,将出现一个滑块,允许用户直观地浏览图形。要做到这一点,需要提供一组图形、一个标题和一组可选的说明文字。
在下面的示例中,我们将读取MNE徽标作为Matplotlib图形,并以不同的角度旋转它。每个旋转的图形及其各自的标题将被添加到列表中。
1 | mne_logo_path = Path(mne.__file__).parent / "icons" / "mne_icon-cropped.png" |

添加图像文件
现有的图像可以通过mne.Report.add_image()添加到报告中。支持的图像格式包括JPEG、PNG、GIF和SVG,可能还有其他格式。与使用Matplotlib图形一样,可以指定在图像下方显示的标题。
1 | report = mne.Report(title="Image example") |
添加标签
每个add_*方法都接受一个关键字参数标记,可以使用它传递一个或多个tag来与各自的内容元素相关联。默认情况下,每个add_*方法添加一个描述数据类型的标记,例如,evoked或source-estimate。在查看HTML报告时,可以使用“按标签筛选”下拉菜单以交互方式显示或隐藏带有特定标签的内容。要切换所有tag的可见性,可以使用Filter by tags下拉菜单中的相应复选框,或按T。
1 | report = mne.Report(title="Tags example") |
编辑已经保存的报告
我们不能将.HTML文件作为Report对象读取回来。为了能够编辑报告,可以将其保存为HDF5文件而不是HTML:
1 | report = mne.Report(title="Saved report example", verbose=True) |
保存的report可以修改。这允许在pipeline中运行多个脚本,其中每个脚本向现有报告添加新内容。
1 | report_from_disk = mne.open_report("report_partial.hdf5") |
为了让事情更简单,mne.report可以用作上下文管理器,注意with语句:
1 | with mne.open_report("report_partial.hdf5") as report: |
添加整个文件夹的文件
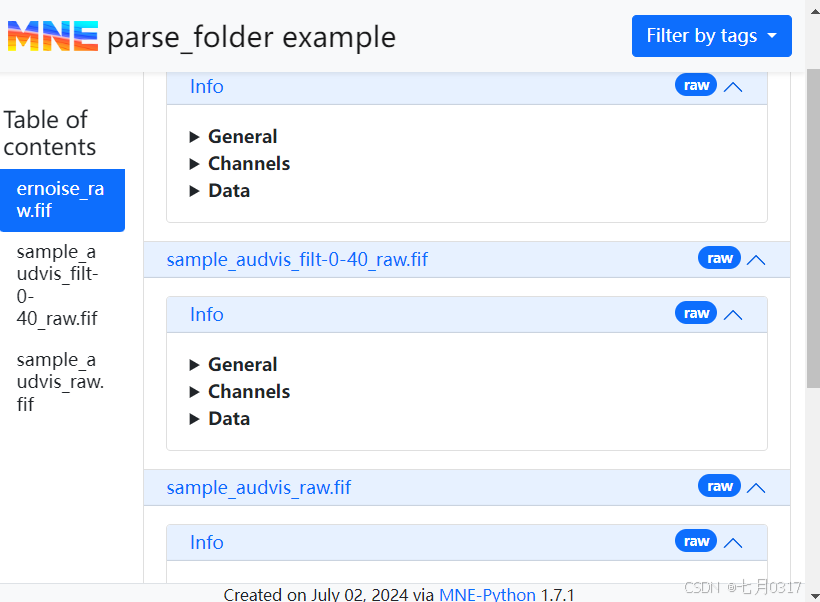
mne还提供了一种方法,可以一次将整个文件文件夹添加到报告中,而不必为每个文件调用上面列出的单独的add_*方法。这种方法虽然方便,但在内容排序、标记、标题等方面灵活性较差。
对于我们的第一个示例,我们可以通过用函数parse_folder()传递*raw.fif为示例数据集中包含原始数据的所有.fif文件生成一个报告。我们将在Report构造函数中省略subject和subjects_dir参数,传递了render_bem=False。为什么呢?不这样的我们将得到一个警告,表示在不知道主题的情况下无法呈现MRI和trans文件。为了节省时间,我们传递raw_butterfly=False来禁用原始数据的蝴蝶图的渲染。
1 | report = mne.Report(title="parse_folder example") |
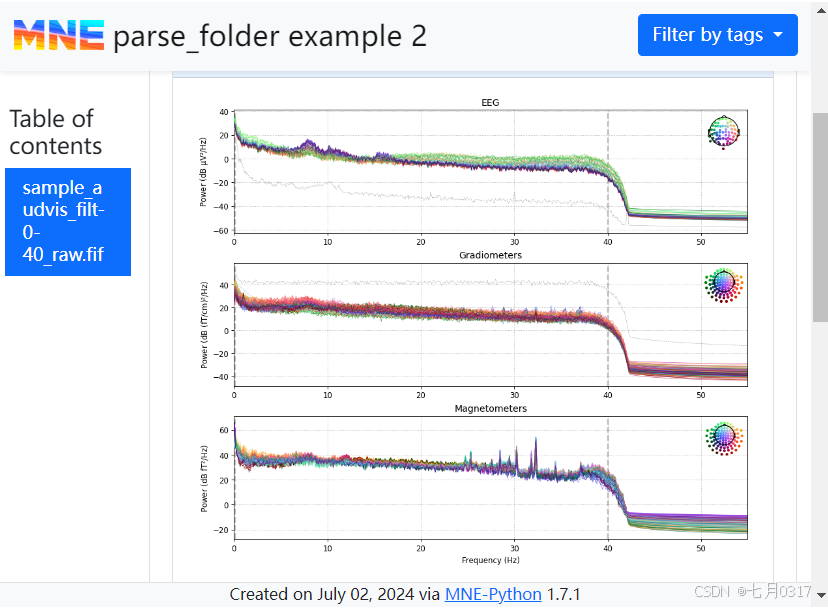
默认情况下不显示raw文件的功率谱密度和SSP projector以加速报告生成。我们可以通过将raw_psd=True和projs=True传递给Report构造函数来添加它们。与前面的示例一样,我们将通过传递raw_butterfly=False来省略蝴蝶图。最后,我们改进只选择过滤过的原始记录,省略未过滤的数据和空房间噪声记录。
1 | pattern = "sample_audvis_filt-0-40_raw.fif" |
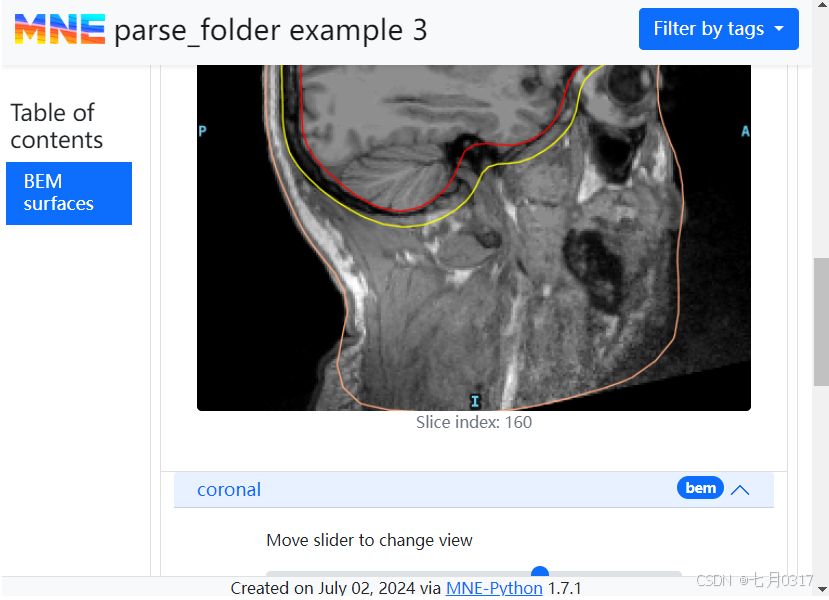
这一次,我们将传递一个特定的subject和subjects_dir,并删除render_bem=False参数,这样就可以看到MRI切片和BEM模型,为了便于文档服务器的计算,官方教材还传递了mri_decim参数,并跳过处理.fif文件。
1 | report = mne.Report( |
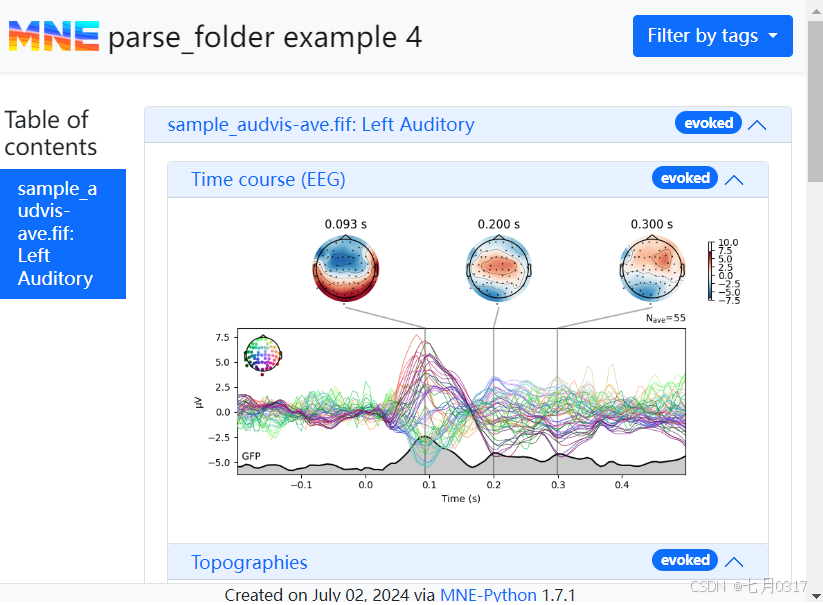
现在让我们看看Report如何处理evoked数据。我们在这个例子中使用的MNE样本数据集没有进行基线校正,所以现在让我们对report应用基线校正。在这里,我们将对从时间间隔的开始到零点的基线时期应用基线校正。最后进行一个协方差校正。
1 | baseline = (None, 0) |
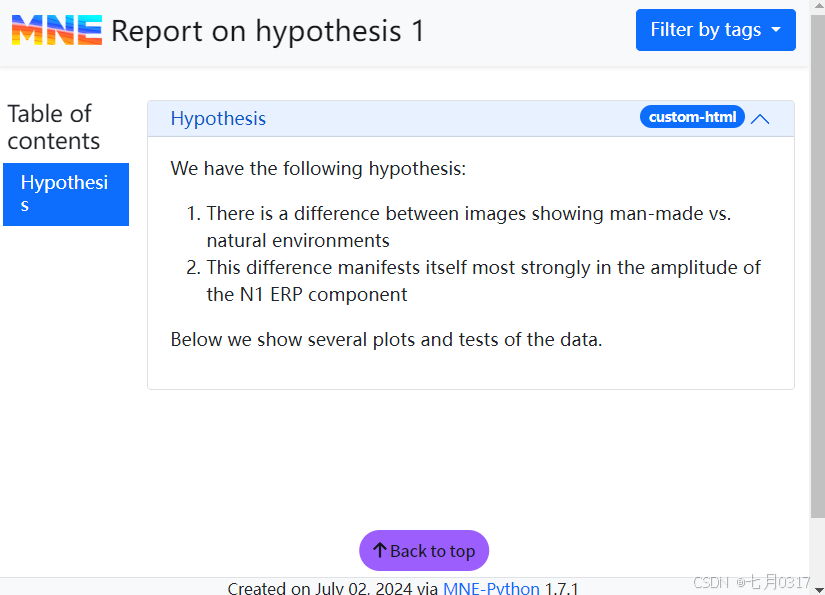
添加自定义html
add_html()方法允许我们向报表中添加自定义HTML。
1 | report = mne.Report(title="Report on hypothesis 1") |